


The S&P 500 took over headlines on a Friday in early February when it closed above 5,000 points for the first time.
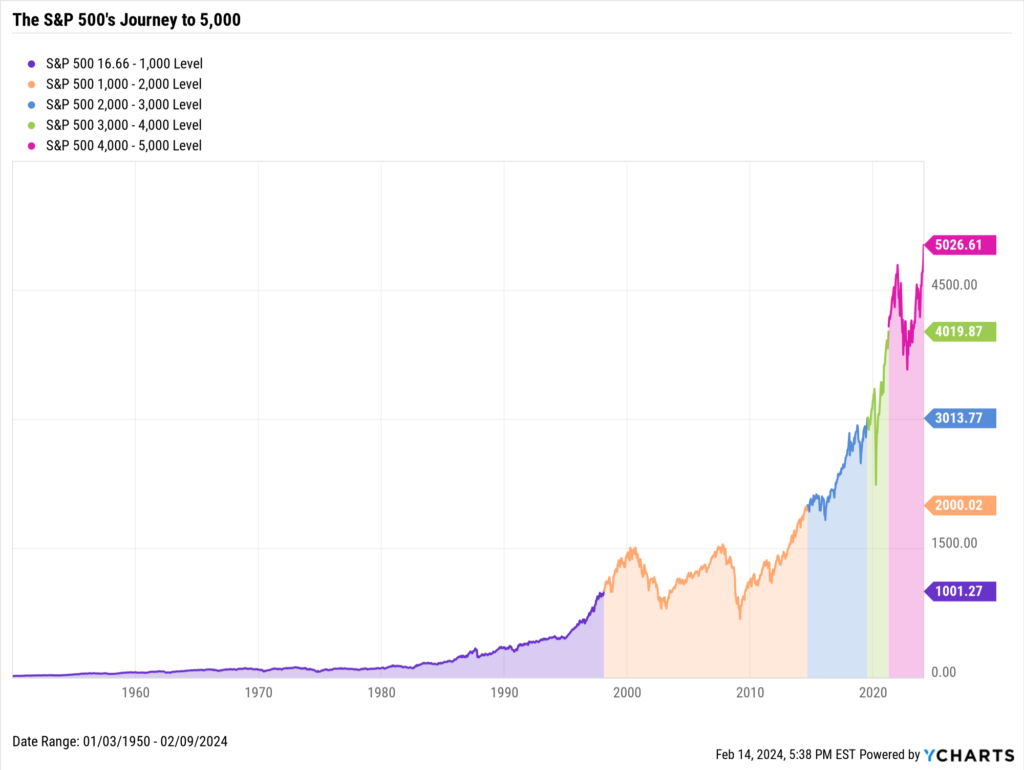
From humble beginnings at just 16.66 points in January 1950, the widely-followed benchmark index has traveled far in the almost 75 years since, generating incredible wealth along the way.
We’ll explore the S&P 500’s journey to each 1,000-point milestone, lessons about volatility learned on the path to each level, and answer the question: How can advisors prepare their clients for ups and downs on the road to 6,000 and beyond?
Where Is the Market Right Now?
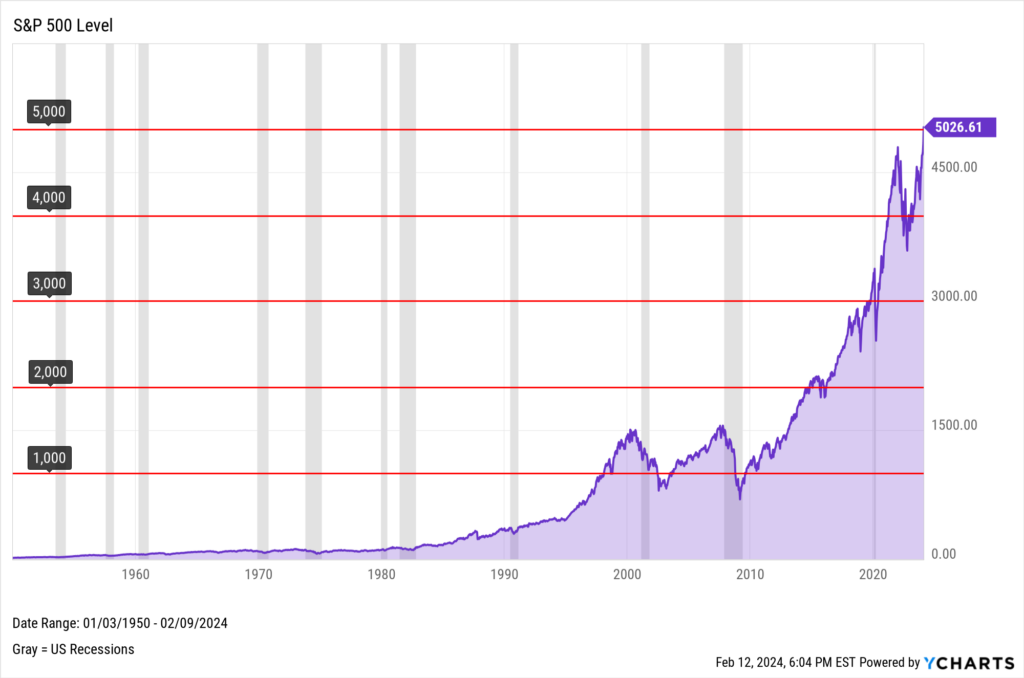
The S&P 500 closed above 5,000 for the first time on February 9th, 2023, at 5,026.61. The index’s journey from 16.66 to 5,000 elapsed 74 years, 1 month, and 7 calendar days.
Each horizontal red line marks a 1,000-point increment, while vertical gray bars indicate a recession period.
| S&P 500 Level | Date First Reached (Market Close) | Time to Reach Milestone |
|---|---|---|
| 1,000 | 2/2/1998 | 48 years, 1 month, 0 days |
| 2,000 | 8/26/2014 | 16 years, 6 months, 25 days |
| 3,000 | 7/12/2019 | 4 years, 10 months, 17 days |
| 4,000 | 4/1/2021 | 1 year, 8 months, 21 days |
| 5,000 | 2/9/2024 | 2 years, 10 months, 9 days |